Data model & I/O specification
What your data looks like as it moves through the framework, and what biology each method asks for and gives back. If you work with B-cell receptor repertoires, this is the page that maps your sequences and clones onto trees, ancestral sequences, and the evolutionary analyses you can read off them.
How your data is organised
The framework works in the same units you already think in — a repertoire of sequences, grouped into clonal lineages, each reconstructed as a lineage tree.
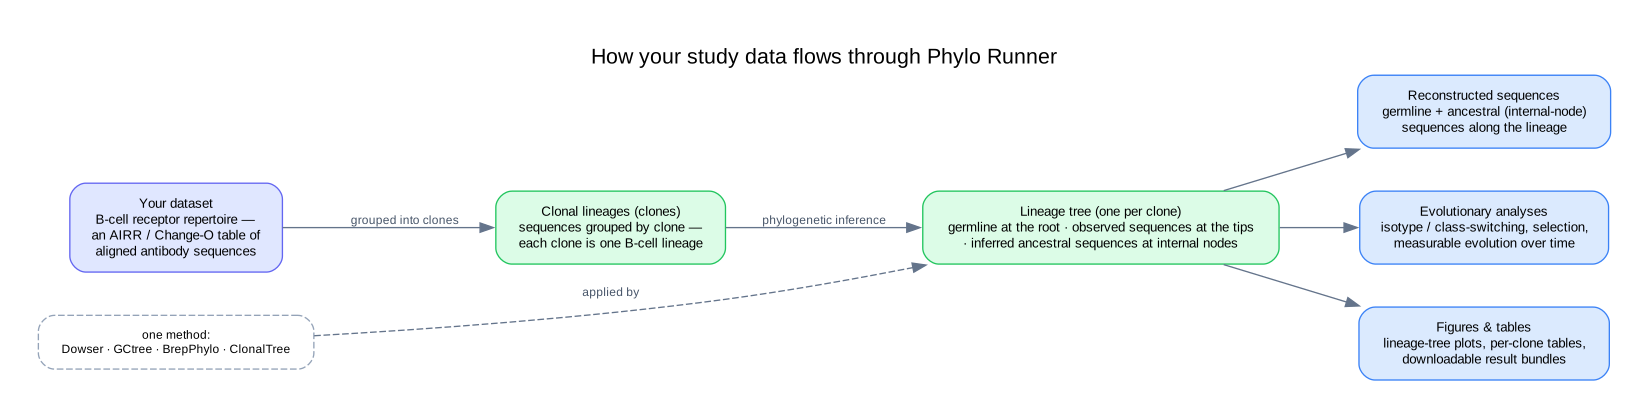
What each method takes in and gives back
All four start from the same kind of data — clonally-related, aligned BCR sequences — and return a lineage tree per clone, but they emphasise different biology. The exact input columns are on the Data requirements page; here is the biology.
Dowser
B-cell receptor phylogenetics in the Immcantation framework
Dowser is an R package in the Immcantation framework for reconstructing and analysing B-cell receptor (BCR) phylogenies. It builds lineage trees from BCR sequences, reconstructs germline and intermediate (internal-node) sequences, and statistically tests for evidence of B-cell evolution, migration and differentiation.
Takes in
Clonally-related, aligned BCR sequences with their clone assignments (and, where the method uses them, germline references and V/J calls).
Gives back
- Lineage trees, one per clone (Newick)
- Per-tree detail — tip labels, node table, reconstructed sequences
- Rendered lineage-tree figures
- Per-tip annotations for plotting
- Clone summary (clone id + sequence count)
- Run summary statistics
- Input quality-control summary
- Data provenance (transformations applied to your data)
- Discrete trait analysis — trait switching along the tree (e.g. isotype, tissue)
- Measurable-evolution / time-resolved analysis
- IgPhyML selection parameters
- Heavy / light chain QC
- Collapse Mapping
Notable analyses
GCtree
Abundance-aware maximum-parsimony B-cell lineage trees
GCtree is a command-line utility and Python package that uses sequence abundance information in phylogenetic inference. It reconstructs genotype-collapsed B-cell lineage trees by combining PHYLIP/dnapars maximum-parsimony analysis with a branching-process ranking that breaks ties between equally parsimonious trees using observed clonal abundances.
Takes in
Clonally-related, aligned BCR sequences with their clone assignments (and, where the method uses them, germline references and V/J calls).
Gives back
- Lineage trees, one per clone (Newick)
- Display Newick
- Rendered lineage-tree figures
- Per-tip annotations for plotting
- Observed abundance per node
- Tip-label ↔ sequence-id map
- Clone summary (clone id + sequence count)
- Run summary statistics
Notable analyses
BrepPhylo
B-cell repertoire lineage trees with class-switch analysis
BrepPhylo is an R package that reconstructs evolutionary lineages of B-cell clonotypes from high-throughput immunoglobulin sequencing data. It wraps established phylogenetic tools so researchers can build lineage trees, identify Class-Switch Recombination (CSR) events, and generate interpretable outputs.
Takes in
Clonally-related, aligned BCR sequences with their clone assignments (and, where the method uses them, germline references and V/J calls).
Gives back
- Lineage trees, one per clone (Newick)
- Rendered lineage-tree figures
- Per-tip annotations for plotting
- Clone summary (clone id + sequence count)
- Analysis — germline distance, class-switch (CSR) events, arborescence
- Per-row / per-clone diagnostics (dropped, rejected, unmapped rows)
- Run summary statistics
Notable analyses
ClonalTree
Minimum-spanning-tree B-cell lineage reconstruction
ClonalTree reconstructs B-cell receptor lineage trees from clonally related sequences. It uses a minimum-spanning-tree algorithm combined with genotype abundance information to infer parsimonious trees representing the evolutionary relationships within a clone.
Takes in
Clonally-related, aligned BCR sequences with their clone assignments (and, where the method uses them, germline references and V/J calls).
Gives back
- Lineage trees, one per clone (Newick)
- Rendered lineage-tree figures
- Per-tip annotations for plotting
- Observed abundance per node
- Tip-label ↔ sequence-id map
- Clone summary (clone id + sequence count)
- Full clone catalog
- Data tables (e.g. clonotype / repertoire info)
- Data provenance (transformations applied to your data)
- Run summary statistics
Notable analyses
Outputs you can download
Every run keeps its outputs so you can revisit, compare and export them. Beyond the on-screen trees, a run produces files of these kinds:
- image — rendered lineage-tree plots (PNG/SVG/PDF)
- newick — the trees themselves, for use in other tools
- fasta — germline and reconstructed ancestral sequences
- table — per-clone / per-node data tables (TSV/CSV)
- json — structured node metadata and statistics
- zip — a bundle of everything for one run
(Full set of artifact kinds: image, newick, table, fasta, json, log, zip, other.) You download or preview these from the run in the dashboard — the framework serves the files to you; you never touch the storage layer directly.
See the full input-column matrixUnder the hood: database schema
For developers and reproducibility: the persistent entities that record every dataset, run and output. A biologist can safely skip this — it is the storage counterpart of the conceptual model above, not new biology.
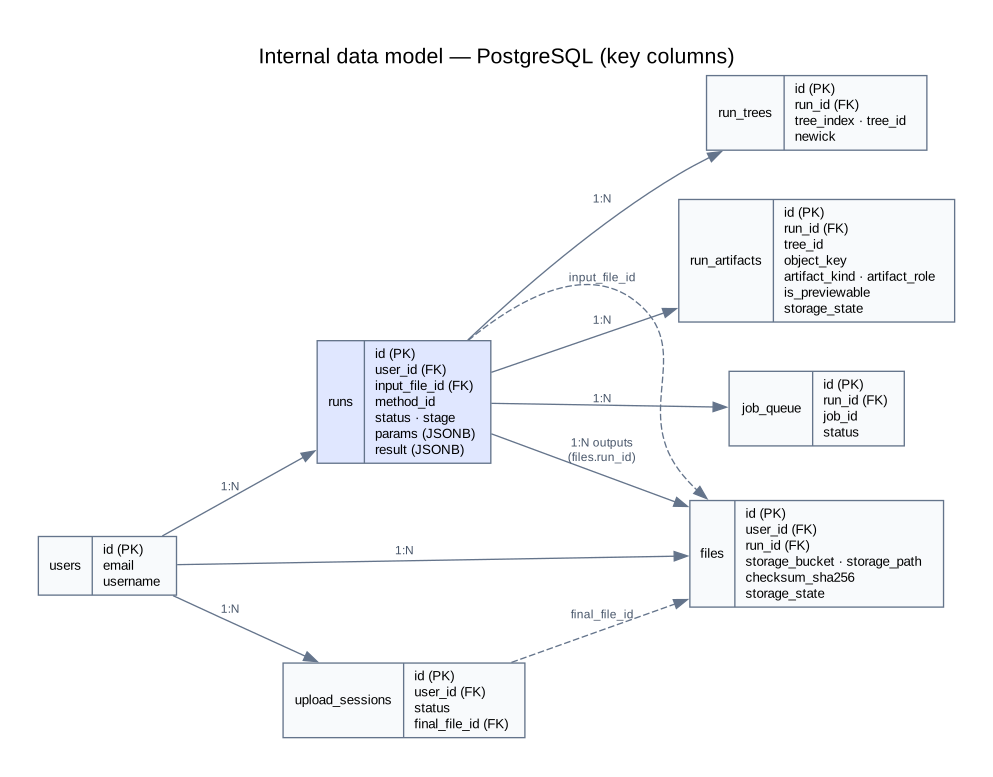
runs.result is a lightweight summary; the actual sequences, trees and figures are stored as files (run_artifacts), while run_trees holds the per-clone Newick and node metadata used to draw and trace lineages.